Distributome Paper published in Computational Statistics Journal

The Probability Distributome team published a new peer-reviewed manuscript entitled Probability Distributome: a web computational infrastructure for exploring the properties, interrelations, and applications of probability distributions in the journal Computational Statistics.

This article presents the Distributome computational and graphical infrastructure and illustrated its functionality for discovery, exploration and application of diverse spectra of probability distributions. The Distributome platform provides human and machine interfaces for traversal, search, and navigation of all common probability distributions. It also enables distribution modeling, applications, investigation of inter-distribution relations, as well as their analytical representations and computational utilization.

Reference

Dinov, ID, Siegrist, K, Pearl, DK, Kalinin, A, Christou, N (2015). Probability Distributome: a web computational infrastructure for exploring the properties, interrelations, and applications of probability distributions. Computational Statistics, 594: 1-19. DOI: 10.1007/s00180-015-0594-6.
Computational Statistics

Distributome Game 3 (Monty Hall Style)

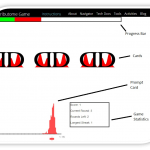
Distributome Game 3 (Monty Hall/3-shell style) was just released on the Distributome website. The objective of this game is to score the most amount of points by choosing the card (density graph) that matches the given distribution plot.

This game is a variation of the 3-card Monty Hall game, also known as the 3 card game or 3 shell game. The game begins when the start button is pressed. Afterwards, all cards on the field are flipped face up for a brief interval in order to reveal each card’s density curve. Next, all cards are once again flipped face down, and around on the board. Once the cards have finished being shuffled, the prompt square will either ask for a certain distribution by name or by its corresponding histogram, depending on the mode that is currently selected. Once a card has been selected, the appropriate amount of points will be added to the player’s score, and the next round will begin. Game ends when when the pre-selected number of rounds have passed. Players receive 1 point per each correct answer. No points are deducted for incorrect answers.

New Distributome Game (Game 2)


A new Distributome Game (Game 2) is designed, implemented and serviced as a webapp on the Distributome website.
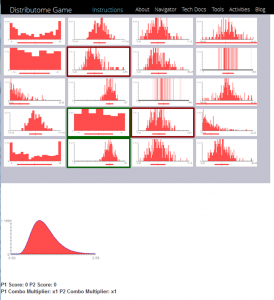
The objective of this game is to score the most amount of points by matching the given density curve with its corresponding histograms. The Game Board shows all of the possible histograms that can be matched to a given density curve. The game begins when the current density graph is revealed. At this point, the player has to find the correct histograms within the time limit. Once the time limit is reached, the corresponding histograms are flipped face down, and the next round begins with a different starting density graph.

Players receive 1 point per each correct histogram match (there are two correct histograms per density curve), and lose one point for each incorrect histogram guess. No points are awarded or deducted if nothing is selected. Each player is also awarded a score multiplier after each round. Initially, there is a score multiplier of 1x. The multiplier is doubled by choosing both of the corresponding histograms in a round. Choosing an incorrect histogram resets the multiplier back to 1x. The game ends when all graphs have been shown.

There are a number of options that can be specified by the user prior to starting the game. For instance, number of graphs (defining the number of graphs and the number of rounds to be presented), sample size (determining the sample size of the histograms), type of game (specifying the pool that the graphs will be drawn from), same speed, game difficulty, etc.

Updates/Expansions to the set of Problems/Processes would be easy (expand in this CSV format):
Game meta-data SVN
Distributome Game 2 Webapp
Current Meta-Data (CSV)

Distributome Game Update

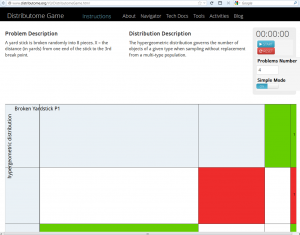
The Distributome Game was updated to improve the new gaming experiences of the users. The point of the Distributome Game is to correctly identify correspondences between pairs of natural processes (represented as problems) and probability distributions (as models). This snapshot  shows an example with correct and incorrectly identified pairs of problems and models.

  1. Source Code SVN: https://distributome.googlecode.com/svn/trunk/web_site/V3
  2. Webapp: http://www.distributome.org/V3/DistributomeGame.html

Updates/Expansions to the set of Problems/Processes would be easy (expand in this CSV format):

  1. Problem-Distribution Meta-Data SVN
  2. Current Meta-Data (CSV)

Distributome Game

There are diverse kinds of natural processes and only a small finite number of well-described probability distribution models. One can gain intuition about the varieties of different processes and the characteristics of different probability distributions by interactively exploring their properties using the Distributome tools (calculators, simulators and experiments). The Probability Distributome Game Webapp enables this exploration of natural phenomena and models as a game of matching pairs of processes and distributions.

The goal of the Distributome Game is to correctly identify the correspondences between pairs of processes (represented as problems) and probability distributions (as models).

How to play?

  • The game board is a Cartesian plane where Rows and Columns represent problems/processes and distribution models, respectively.
  • As you move the mouse over the grid, the zoom-function automatically expands the Cartesian space around the mouse location. Matching Problem-Distribution pairs corresponding for the current location are highlighted.
  • Try to find which distribution(s) may represent good model(s) for the process described in the problem.
  • Use one mouse click on a cell in this 2D Cartesian plane to select and highlight a matching problem-distribution pair. Correct or incorrect matches are indicated by green and red cell background coloring, respectively.
  • Clicking on a highlighted cell provides access to appropriate Distributome tools for the selected distribution and optional hints for solving the problem.

Details

The Distributome Game is available at:

  1. Source Code SVN: https://distributome.googlecode.com/svn/trunk/web_site/V3
  2. Webapp: http://www.distributome.org/V3/DistributomeGame.html

Updates/Expansions to the set of Problems/Processes would be easy (expand in this CSV format):

  1. Problem-Distribution Meta-Data SVN
  2. Current Meta-Data (CSV)

Future Improvements

  1. Always pick the same number of rows – say 20 picked randomly from problem database and add a clock so players try to beat their best time and score.  Score = # of guesses until all correct plus number of hints requested + 10*(#of seconds used).  Low scores are good.
  2.  After you make a selection the cell could stay the same color (red or green as the case may be) until the whole round is over (start-over button)?  That way players can know which problems they have completed and how many errors they have made total.
  3.  Label the columns with the distribution names and have them alphabetical so players can easily find the one they are looking for (this is related to the search functionality)
  4.  Perhaps allow for problems to be picked from the level of distributions appropriate (i.e., top level, middle level, or all).
  5.  Introduce three modes of play.
      1. Beginner mode = see the distribution descriptions and only have columns for the distributions used in the round of play.
      2. Intermediate mode = don’t see the distribution descriptions and only have columns for distributions used in the round of play.
      3. Advanced mode = don’t see the distribution descriptions and have columns for all distributions at level under use.
  6.  Another possibility may be to allow some way to enter numerical values of parameters when they are given in the problem.  For example, when you get a distribution correct (green rectangle) that has numerical answers to parameter values then a “bonus” box is seen with place(s) to enter parameter(s) and students get 1 bonus point for each correct parameter removed from their score.  This might detract from the flow of the game – but it would be nice to require parameter values where appropriate.

Distributome Navigator V.3: Status Update

This is an update on the recent developments of the Probability Distributome project:

(1) We have V.3 of the Navigator available online

(2) All these changes are pushed to:

(3) Documentation is available online:

(4) Further ongoing Distributome Developments:

  • The Distributome DB Editor is still being developed and will allow crowd-based contributions in editing, expanding, correcting and updating the Distributome Database.
  • Transition from Protovis to D3 JavaScript library.
  • Other features, improvements and customizations are also ongoing.
  • We are expanding the collection of tools (calc, sim, exp).
  • We are drafting additional activities.

Distributome XML Database: Types of distributions/nodes and relations/edges

The following types of Distributions (nodes) and relations (edges) are currently allowed. These may later be modified or expanded. These types are referred to in the Distributome.xml Database (see the HTML rendering of the XML).

Node (distribution) Types will be (full-Name and abbreviation)

  • 0 No Type Given
  • 1 Convolution (Conv)
  • 2 Memoryless (Mless)
  • 3 Inverse (Inv)
  • 4 Linear Combination (LinComb)
  • 5 Minimum (min)
  • 6 Maximum (max)
  • 7 Product (Prod)
  • 8 Conditional ResIDual (CondRes)
  • 9 Scaling (Scale)
  • 10 Simulate (Sim)
  • 11 Variate Generation(VGen)

Edge Types (directional distribution relations)

  • 0 No Type Given
  • 1 Special Case (SC)
  • 2 Transform (T)
  • 3 Limiting (Lim)
  • 4 Bayesian (Bayes)

Distributome Navigator Status: Preference Files and Tool Validation

Below is the status of the Probability Distributome Navigator which describes the new textbook based ontological classification of distributions, using a preference XML file, and the  current status of the integration of the Navigator and different Distributome tools (calculators, experiments, and simulators), also see the technical documentation.

Ontology
Hierarchy
 
Distribution  Calculator  Experiment  Simulator  Notes 
TopLevel Bernoulli OK missing missing
Binomial OK OK missing
Discrete
Uniform
OK missing OK
Geometric OK
(validate!)
missing missing
Hypergeometric OK OK missing
Multinomial missing missing missing
Negative
Binomial
OK OK missing
Poisson OK
(validate!)
OK OK
MiddleLevel Beta OK missing OK
Cauchy OK missing OK
Chi-Square OK missing OK
Continuous
Uniform
OK missing OK
Exponential OK
(validate!)
missing missing
F
(Fisher’s F)
OK missing OK
Gamma OK OK OK
Normal OK missing OK
Pareto OK missing OK